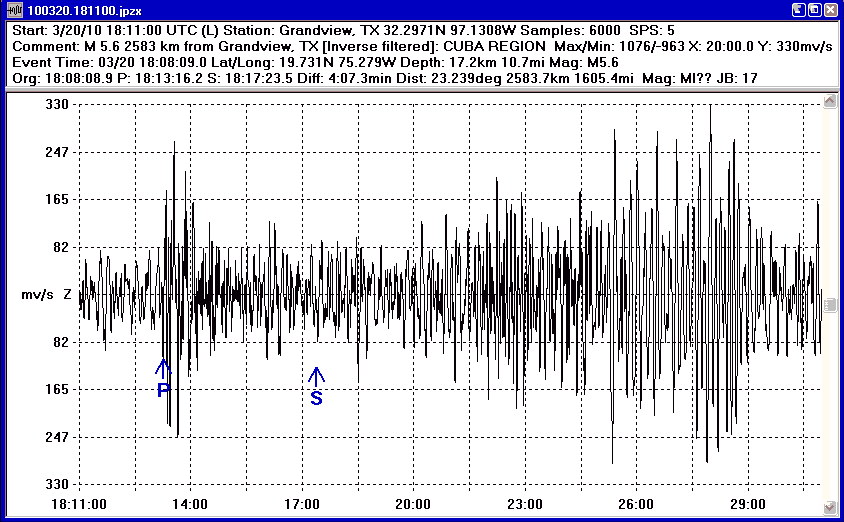

Line 1: This line displays general information about the event file and recording station.
Start:
Displays the start time of the event file. The (L) after the start time indicates that the data logging system was locked to some time reference. A (?) after the start time indicates that the data logging system was locked to a time reference, but it was been more then 24 hours since new time information has been received.Station: Displays the recording stations name or location.
Samples: The number of analog to digital (A/D) samples in the event file.
SPS: Displays the sample rate in samples per second.
Line 2: This line displays the comment and other information about the event file and event window settings.
Comment:
Displays a comment about the event.Max/Min: Displays the maximum and minimum A/D counts in the dataset.
X: Displays the current X scale time.
Y: Displays the current Y scale value.
Line 3: This line displays the event report information.
Event Time:
Displays the event origin time.Lat/Long: Displays the event latitude and longitude.
Depth: Displays the event depth.
Mag: Displays the event magnitude.
Line 4: This line displays the calculated distance and magnitude based on the location of P and S markers.
Org:
Displays the calculated time of origin of the event.P: Displays the P marker time.
S: Displays the S marker time.
Diff: Displays the time difference between the P and S markers.
Dist: Displays the calculated distance based on the P and S time difference and the currently selected travel-time tables and depth. The distance is displayed in degrees, kilometers and miles.
Mag: Displays the calculated magnitude(s).
JB: or Reg: Displays which travel-time table set is currently selected. Also displays the currently selected travel-time table depth. When JB: is display, the teleseismic travel-time tables are active. When Reg: is displayed, the regional tables are active.
Lines 1, 2 and 3 will be displayed if the Text item under the View menu is checked. Line 4 will be displayed when the Calculate Distance / Magnitude option is checked in the Calculate menu. The PS toolbar icon can also be used to enable or disable the distance and magnitude calculation.
The text font and size can be controlled by selecting the Font / Text Window item under the Options menu.
The size of the text part of the display can also be changed by moving the bar separating the text and time domain graph.
Below the text information is the time domain graph of the dataset. The X and Y grid can be turned on or off using the Options menu. The dataset can be inverted using the Invert Data item under the View menu.
You can zoom into a section of the seismogram by using the mouse or the X-Scale dialog box. To use the mouse, do the following:
- Move the mouse to the starting point on the graph where you want to zoom into.
- Double click and hold down the left button.
- Move the mouse to the end point. As you move the mouse a box should be drawn around the area that will be displayed.
- Release the left button. The program will then zoom into the selected area.
To zoom out, select the Reset item under the View menu, press the RST toolbar icon, or use the X-Scale dialog box.
Each Event Window can display up to three event files. The purpose is to display the data from a two or three component (North-South, East-West and Vertical) sensor. Only event files that have the same start time, sample count, sample rate and sensor type (displacement, velocity or accelerometer) can be added to the the same Event Window. Event files can be added to the same window by using the Open File dialog box and selecting two or three files. WinQuake will check to see if the event files you have selected have the same parameters describe above, if they are all the same, the files will be displayed in one Event Window. The user can also use the File / Add menu items to add more files to the Event Window. The user can remove the currently selected file or record by using the File / Remove menu items. See the New Menu Items documentation below for more information.
WinQuake now supports dataset volumes. PSN Dataset volumes contain two or three event records in one event file. See the PSN Type 4 format documentation for more information on the dataset format. Dataset volumes can be created using the File / Add feature and then saved using the File Save dialog box. Dataset volumes can saved as individual files by deselecting the Dataset Volume check box in the File Save dialog box.
Once a dataset volume is loaded, or if more then one file is added to the Event Window, the used can view one record by double-clicking on the Y-Scale area of the Event Window. To display all records again, double-click on the Y-Scale area.